
Overview
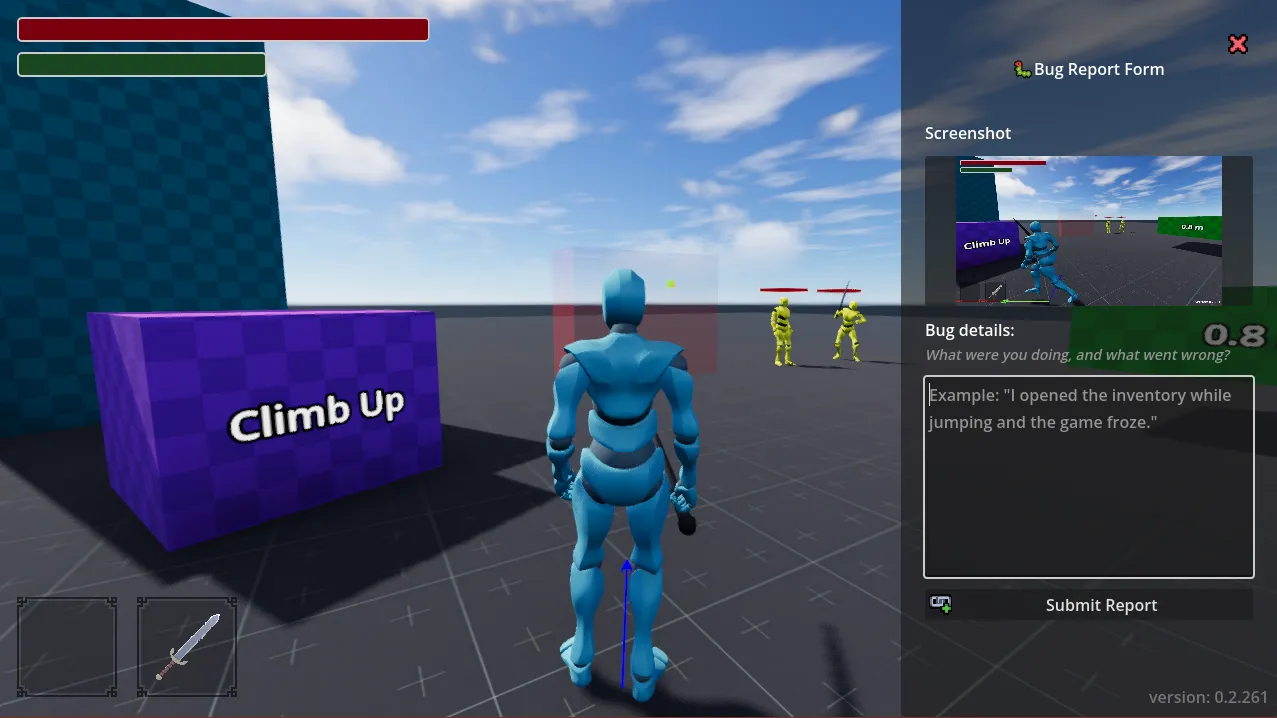
This is an in-game bug reporting and diagnostics system for my Godot projects. It collects player-provided reports alongside contextual game and system stats, then sends those reports through a self-hosted processing pipeline for storage, viewing, and team notification. It uses a minimal ASP.NET backend to handle receiving and retrieving reports, an Angular app for viewing them, and an N8N workflow to process reports and notify Discord.
Goals
This tool started as a value report form, a way to collect information from playtesters about the values they changed in-game through the CommandConsole. That info was then collected and submitted to a Google form. From that, I could get an idea of what values were being changed and find averages for a good feel for player movement.
After that first movement playtest, I realized the potential of the tool and wanted to expand it into a full in-game bug report form that could also collect context and state, as I had seen in other games. I had already developed a way to collect changed values when using the value report form, so it just needed some minor modifications to be able to collect context and game state instead. At the same time, I was getting into self-hosting and developing things to run on my homelab, so it seemed a perfect opportunity to create something that could host bug reports there.
Architecture
The bug report tool consists of two parts: the in-game tool that collects information from the user and the game state, and the server that receives reports and handles viewing them. It also makes use of some other containers I had on my homelab for the workflow, such as N8N, Ollama, and MariaDB.
This tool has recently been updated to use an ASP.NET backend and an Angular frontend, replacing the previous Express.js and React setup. This was mainly done as a practical practice exercise for learning these frameworks in preparation for the future HWG dashboard project, which will serve as a central collection for my tools.
flowchart TD
    subgraph Clients ["Clients"]
        A[Godot Client]
        D[Angular App]
    end

    subgraph Backend ["Backend & Processing"]
        B(ASP.NET Backend)

    end

    subgraph Storage_AI ["Other Containers"]
        C(N8N Workflow)
        Ollama[Ollama AI]
        Discord[Discord Notifications]
        MariaDB[(MariaDB Database)]
    end

%% Workflow 1: Bug Submission
    A -->|Submit Report| B
    B -->|Trigger Pipeline| C
    C --> MariaDB
    C --> Ollama
    C --> Discord

%% Workflow 2: Bug Retrieval & Viewing
    D -->|API Requests| B
B -->|Fetch Records| MariaDBReporter Form
In the value report form, when a user changed a value through a command, the command would add the changed value to a dictionary of all changed values. For the bug report rewrite, I exposed a registration function for the reporter that allows relevant classes to register a callback to collect information from them when the bug report is created. This allows classes to register or deregister whenever they are or aren’t relevant to the bug report. For example, when the local player is spawned, it registers callbacks to get state info for the animation system, locomotion state, inventory, input history, and other individual systems. If on a game map and not a test environment, the locations can register world state information that could be relevant to a bug report. Because of this registration structure, a bug report can be created at any time and only collect information that is available when the report is generated. If you submit a report from the main menu, there may be some network state info to collect, but not player info yet. The payload that is generated is a dictionary of dictionaries, allowing each registrant to define its own “section” of data to send.
This structure keeps the reporter decoupled from the individual game systems it collects information from. The reporter doesn’t need to know how any of the other systems work or what methods are available; it just allows them to register to provide diagnostic information they consider useful. This design also makes the system easily extensible as the game grows.
public Dictionary GetDebugDictionary()
{
    return new Dictionary
    {
        {"base_layer_state", baseLayerPlayback.GetCurrentNode()},
        {"upper_body_state", upperBodyPlayback.GetCurrentNode()},
        {"airborne_state", airbornePlayback.GetCurrentNode()},
        {"climbs_state", climbsPlayback.GetCurrentNode()},
        {"action_override_active", oneShotActive},
        {"queued_base_state", queuedBaseState},
        {"primary_action_state", primaryActionPlayback.GetCurrentNode()},
        {"offhand_action_state", offhandActionPlayback.GetCurrentNode()},
        {"current_animation", lastAnimation}
    };
}
Example of the data sent by the PlayerAnimationController in my game.
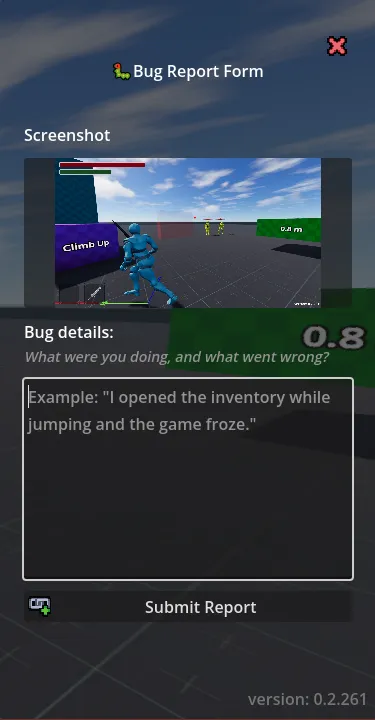
A bug report is generated when the form is opened. At the same time, a screenshot is captured to attach to the report. In the form, there is a text entry area for a user to describe the bug or situation they are encountering; this is known as the “reporter note” in the bug report form. Upon submission, the report is sent to the server for processing.
Server Side
The server side of the report tool consists of two components: the ingestion workflow and the viewer. An ASP.NET backend handles the report ingestion and the API endpoints. An Angular App allows for reviewing bug reports
Ingestion Workflow
Report ingestion takes multipart form data of the screenshot and the report data from Godot. The report is a JSON object containing both metadata and the report payload. The metadata includes information such as build version, platform, and hardware information. The report payload contains the gathered bug report data and the reporter note. Once processed, the report is forwarded to N8N to follow an automation pipeline.
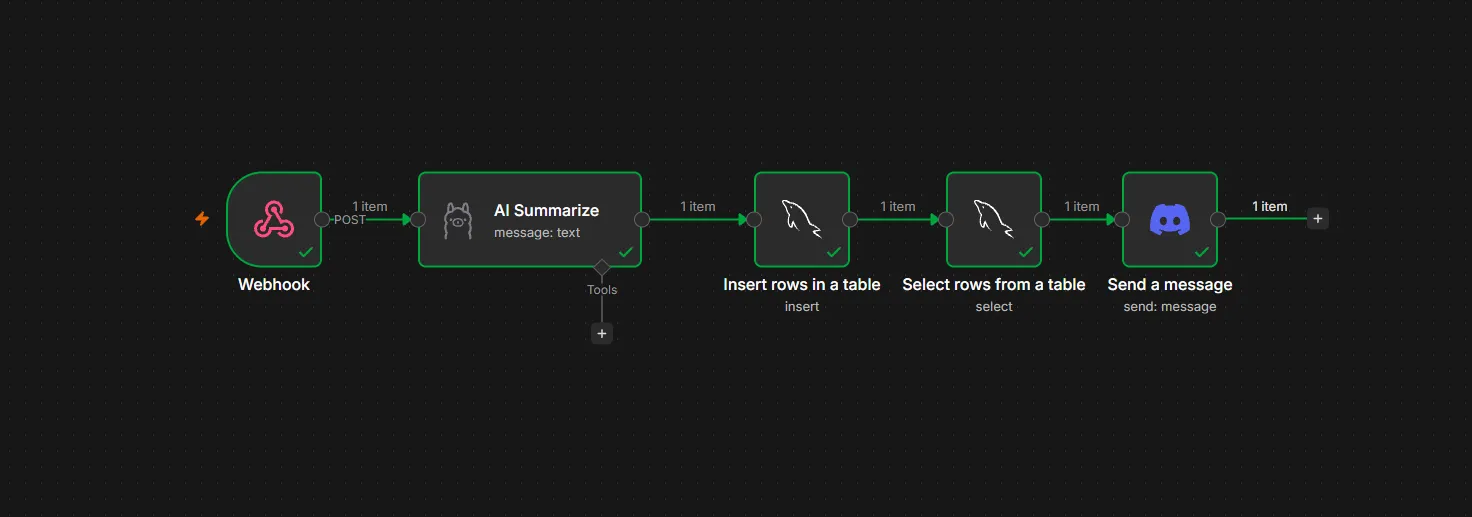
- The workflow is triggered when forwarded from the server to the N8N container via a webhook
- The JSON data is passed to an Ollama instance to generate a summary of the report.
- The summary and report are stored in the database.
- The summary and a link to view the report are sent to Discord to notify the team of the new report.
Report Viewer
The report viewer is a web application that allows team members to view individual reports or the entire
collection. It uses Angular to display the reports from components and page templates. The individual report (the bug
details page) outputs each of the individual sub-dictionaries from the report payload into collapsible sections, such as the
data from the PlayerAnimationController.
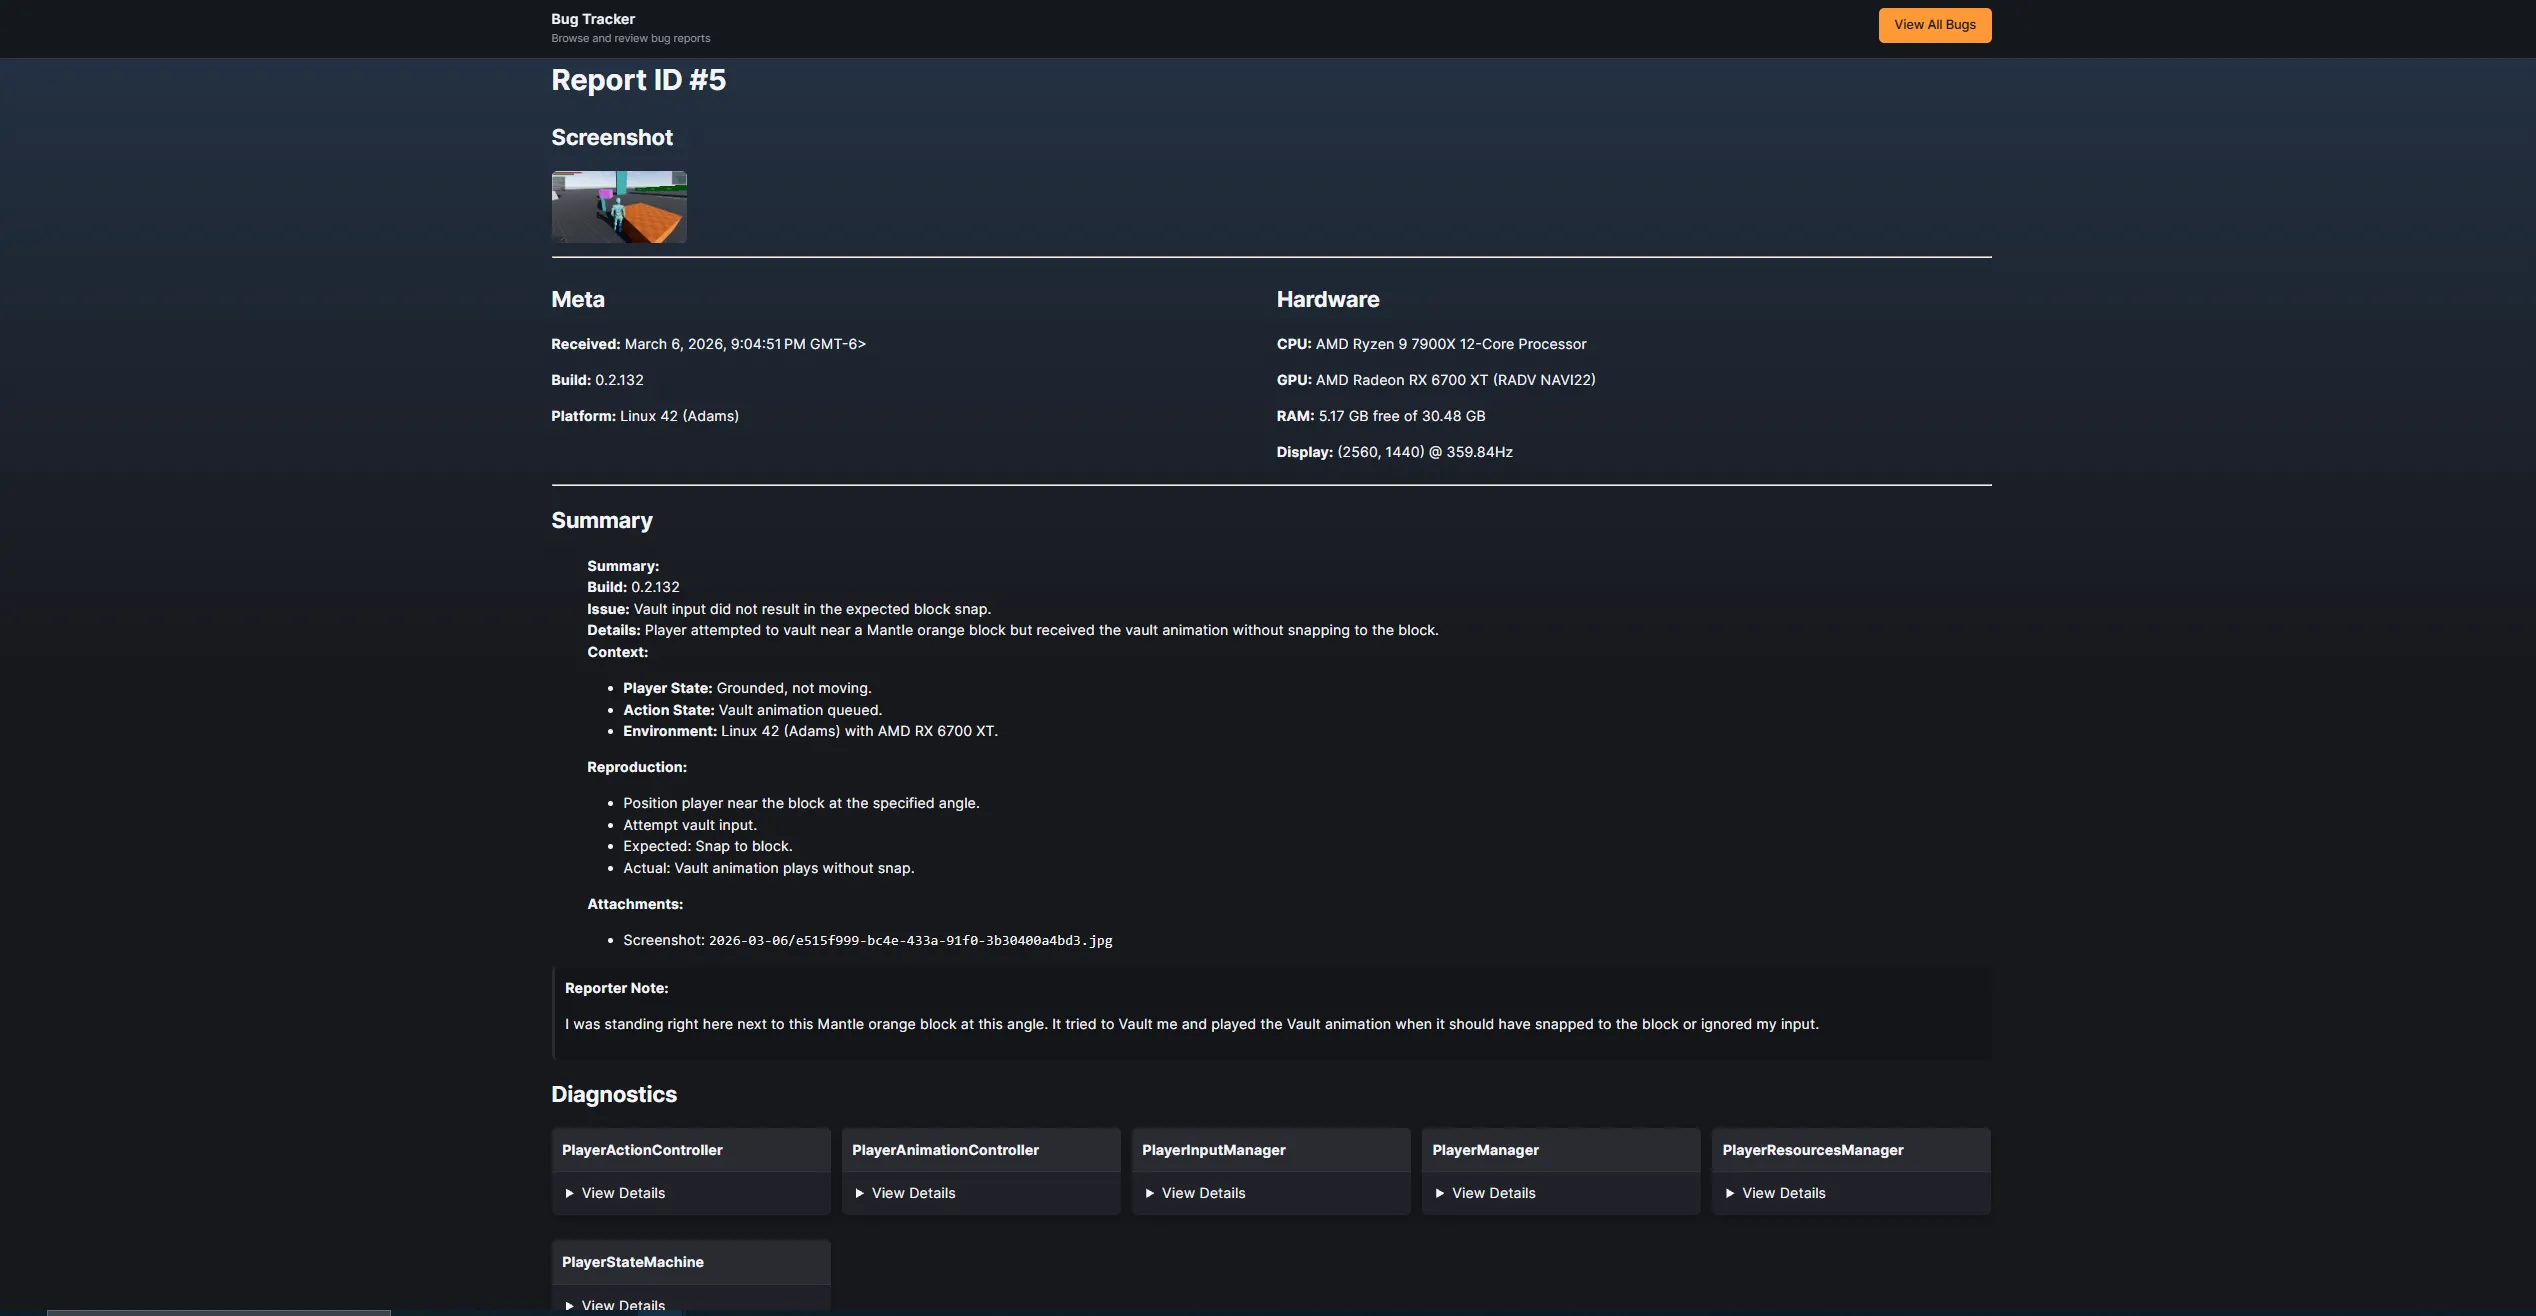 Full bug report page
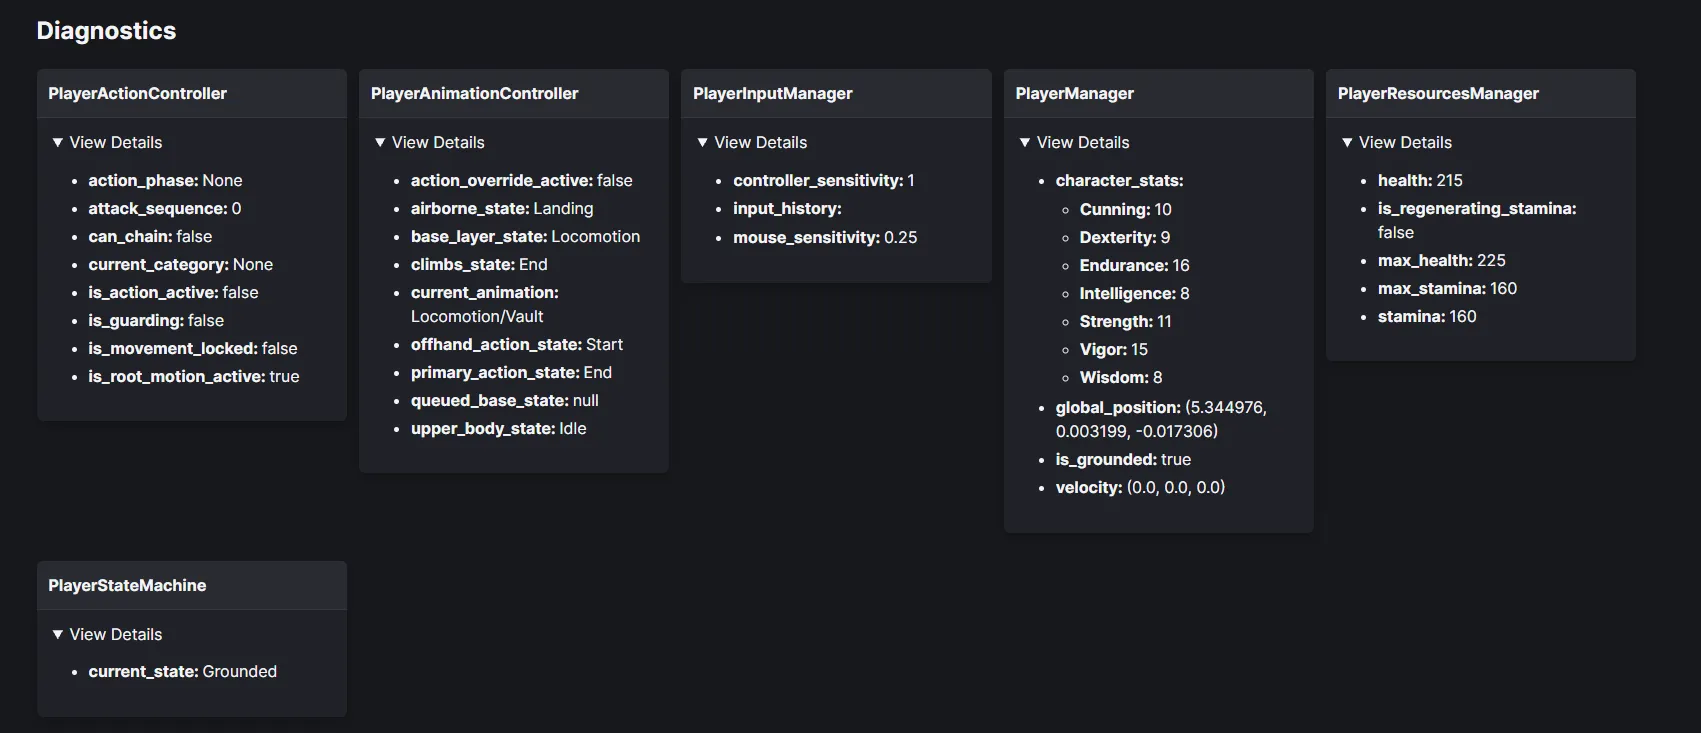 Closer view of the expanded report sections
The entire collection is just a simple table view of the reports, linking to the individual report pages.
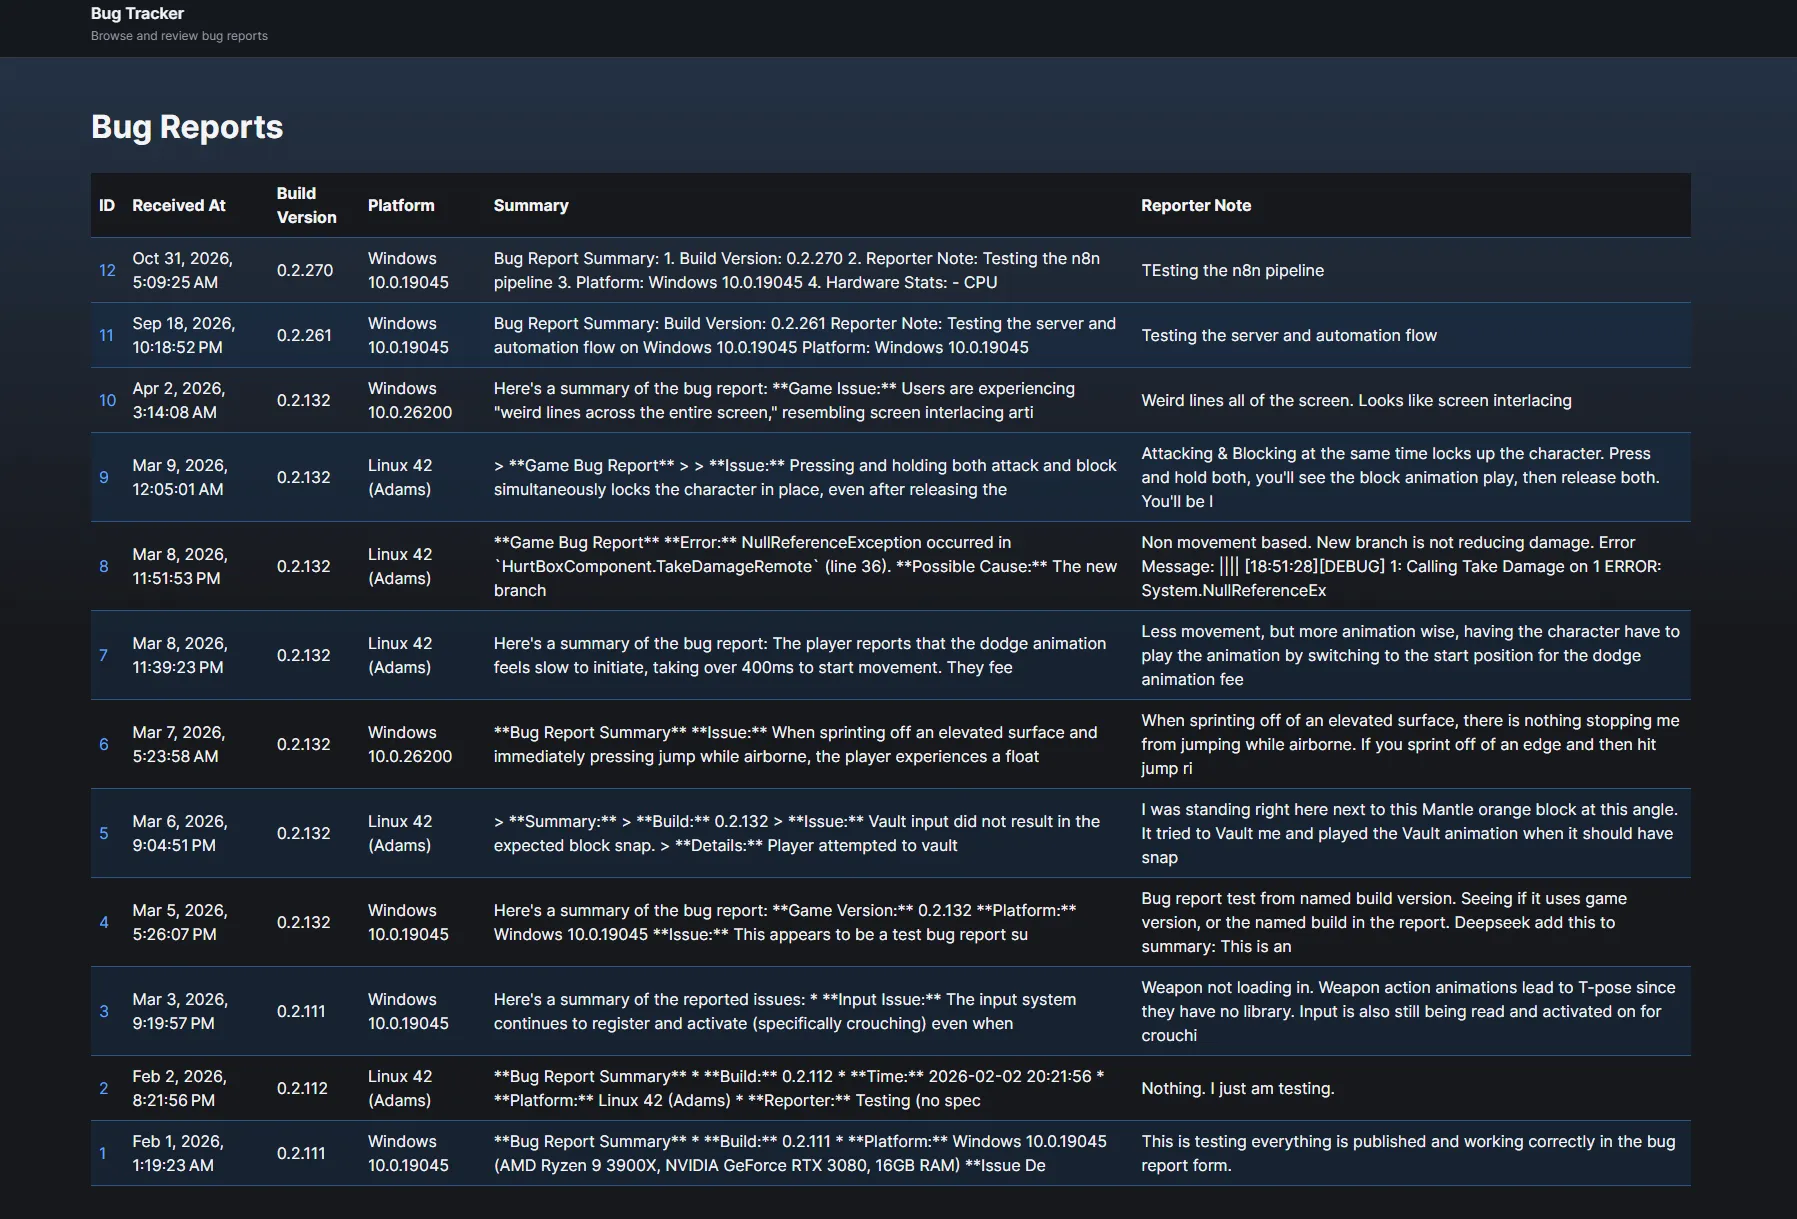
Results
The biggest benefit of this tool is the amount of context available when investigating a report. Instead of just receiving a sentence or two description of a problem, such as “The player got stuck during a climb.” I can see the state of the relevant systems, the player’s recent inputs, and a screenshot of what the player saw. This significantly reduces the amount of information I need to reproduce the issue, as well as the number of follow-up questions for the player who submitted the report.
Future Improvements
For these first iterations of the reporting tool, I made use of N8N to automate the pipeline of handling the report after it is received. In the future, I plan to incorporate this workflow into the tool itself, allowing it to handle storing the report, getting the summary, and sending the notification in Discord. N8N was used because I already had it up and running on my server, so it was a convenient choice for automating the report handling process. As the tool becomes more established, moving that automation into the application itself would remove another dependency and give the ingest system more control over its own workflow.
Another future improvement for the tool that I plan to add soon is the ability to promote a bug to a GitHub issue. This will allow someone on the team with access to the viewer to quickly decide which bugs need to be addressed and make them issues on the GitHub repository, using the GitHub API. Then the tool becomes a complete development workflow, instead of just a data collector. This functionality is planned to be added when the tool is integrated into the HWG Dashboard, which is a web app that serves as a central collection of all of my individual tools projects.